
Most advice about a tiktok engagement rate calculator starts with the maths and stops there. That’s the mistake.
The formula matters, but not nearly as much as what you do with the result. A spreadsheet can tell you a creator’s engagement rate. It can’t tell you whether that creator will drive bookings, redemptions, reviews, or sales. Brands that confuse those two jobs end up optimising for pretty percentages and weak commercial outcomes.
TikTok makes this worse because the platform doesn’t behave like an old-school follower network. Content gets distributed well beyond a creator’s existing audience, so a manual calculation based on follower count often rewards the wrong accounts. If you run influencer campaigns for ecommerce, hospitality, or multi-location brands, the primary job isn’t just to calculate engagement. It’s to connect engagement quality to measurable return.
Your TikTok Engagement Rate is a Vanity Metric
A lot of brands still judge TikTok creators the way they judge Instagram accounts from years ago. They look at follower count, scan a few recent posts, divide interactions by followers, and call it due diligence. That process feels tidy. It also leads to bad buying decisions.
A restaurant group might shortlist a creator with a big audience because the account looks established. A DTC team might assume more followers means more reach. Then the content goes live, views look uneven, comments are weak, and nobody can trace whether the collaboration moved product or footfall.
That’s why the phrase “good engagement rate” needs context. If the metric is built on the wrong denominator, the output is dressed-up noise. Brands that want commercial clarity need to treat engagement as one signal inside a broader measurement system, not the headline result itself. This is the same discipline behind metrics that actually matter in influencer marketing.
The trap with follower-based thinking
Follower-based formulas are appealing because they’re simple. They’re also static in a platform environment that isn’t static at all. TikTok distributes content based on audience response to the video, not loyalty to the account.
That means two creators with very different follower counts can produce videos with similar view volumes and very different business value. If you only look at followers, you miss the thing that matters. How the content performed when people saw it.
You’re not buying an audience on TikTok. You’re buying a chance for content to earn attention.
What brands usually get wrong
The most common errors aren’t technical. They’re operational.
They overvalue account size and undervalue content quality.
They benchmark creators inconsistently by comparing one person’s best post with another person’s average.
They stop at engagement instead of asking whether the campaign produced attributable actions.
A tiktok engagement rate calculator is useful. But if it’s the final layer of analysis, not the first, you’re still operating on vanity metrics.
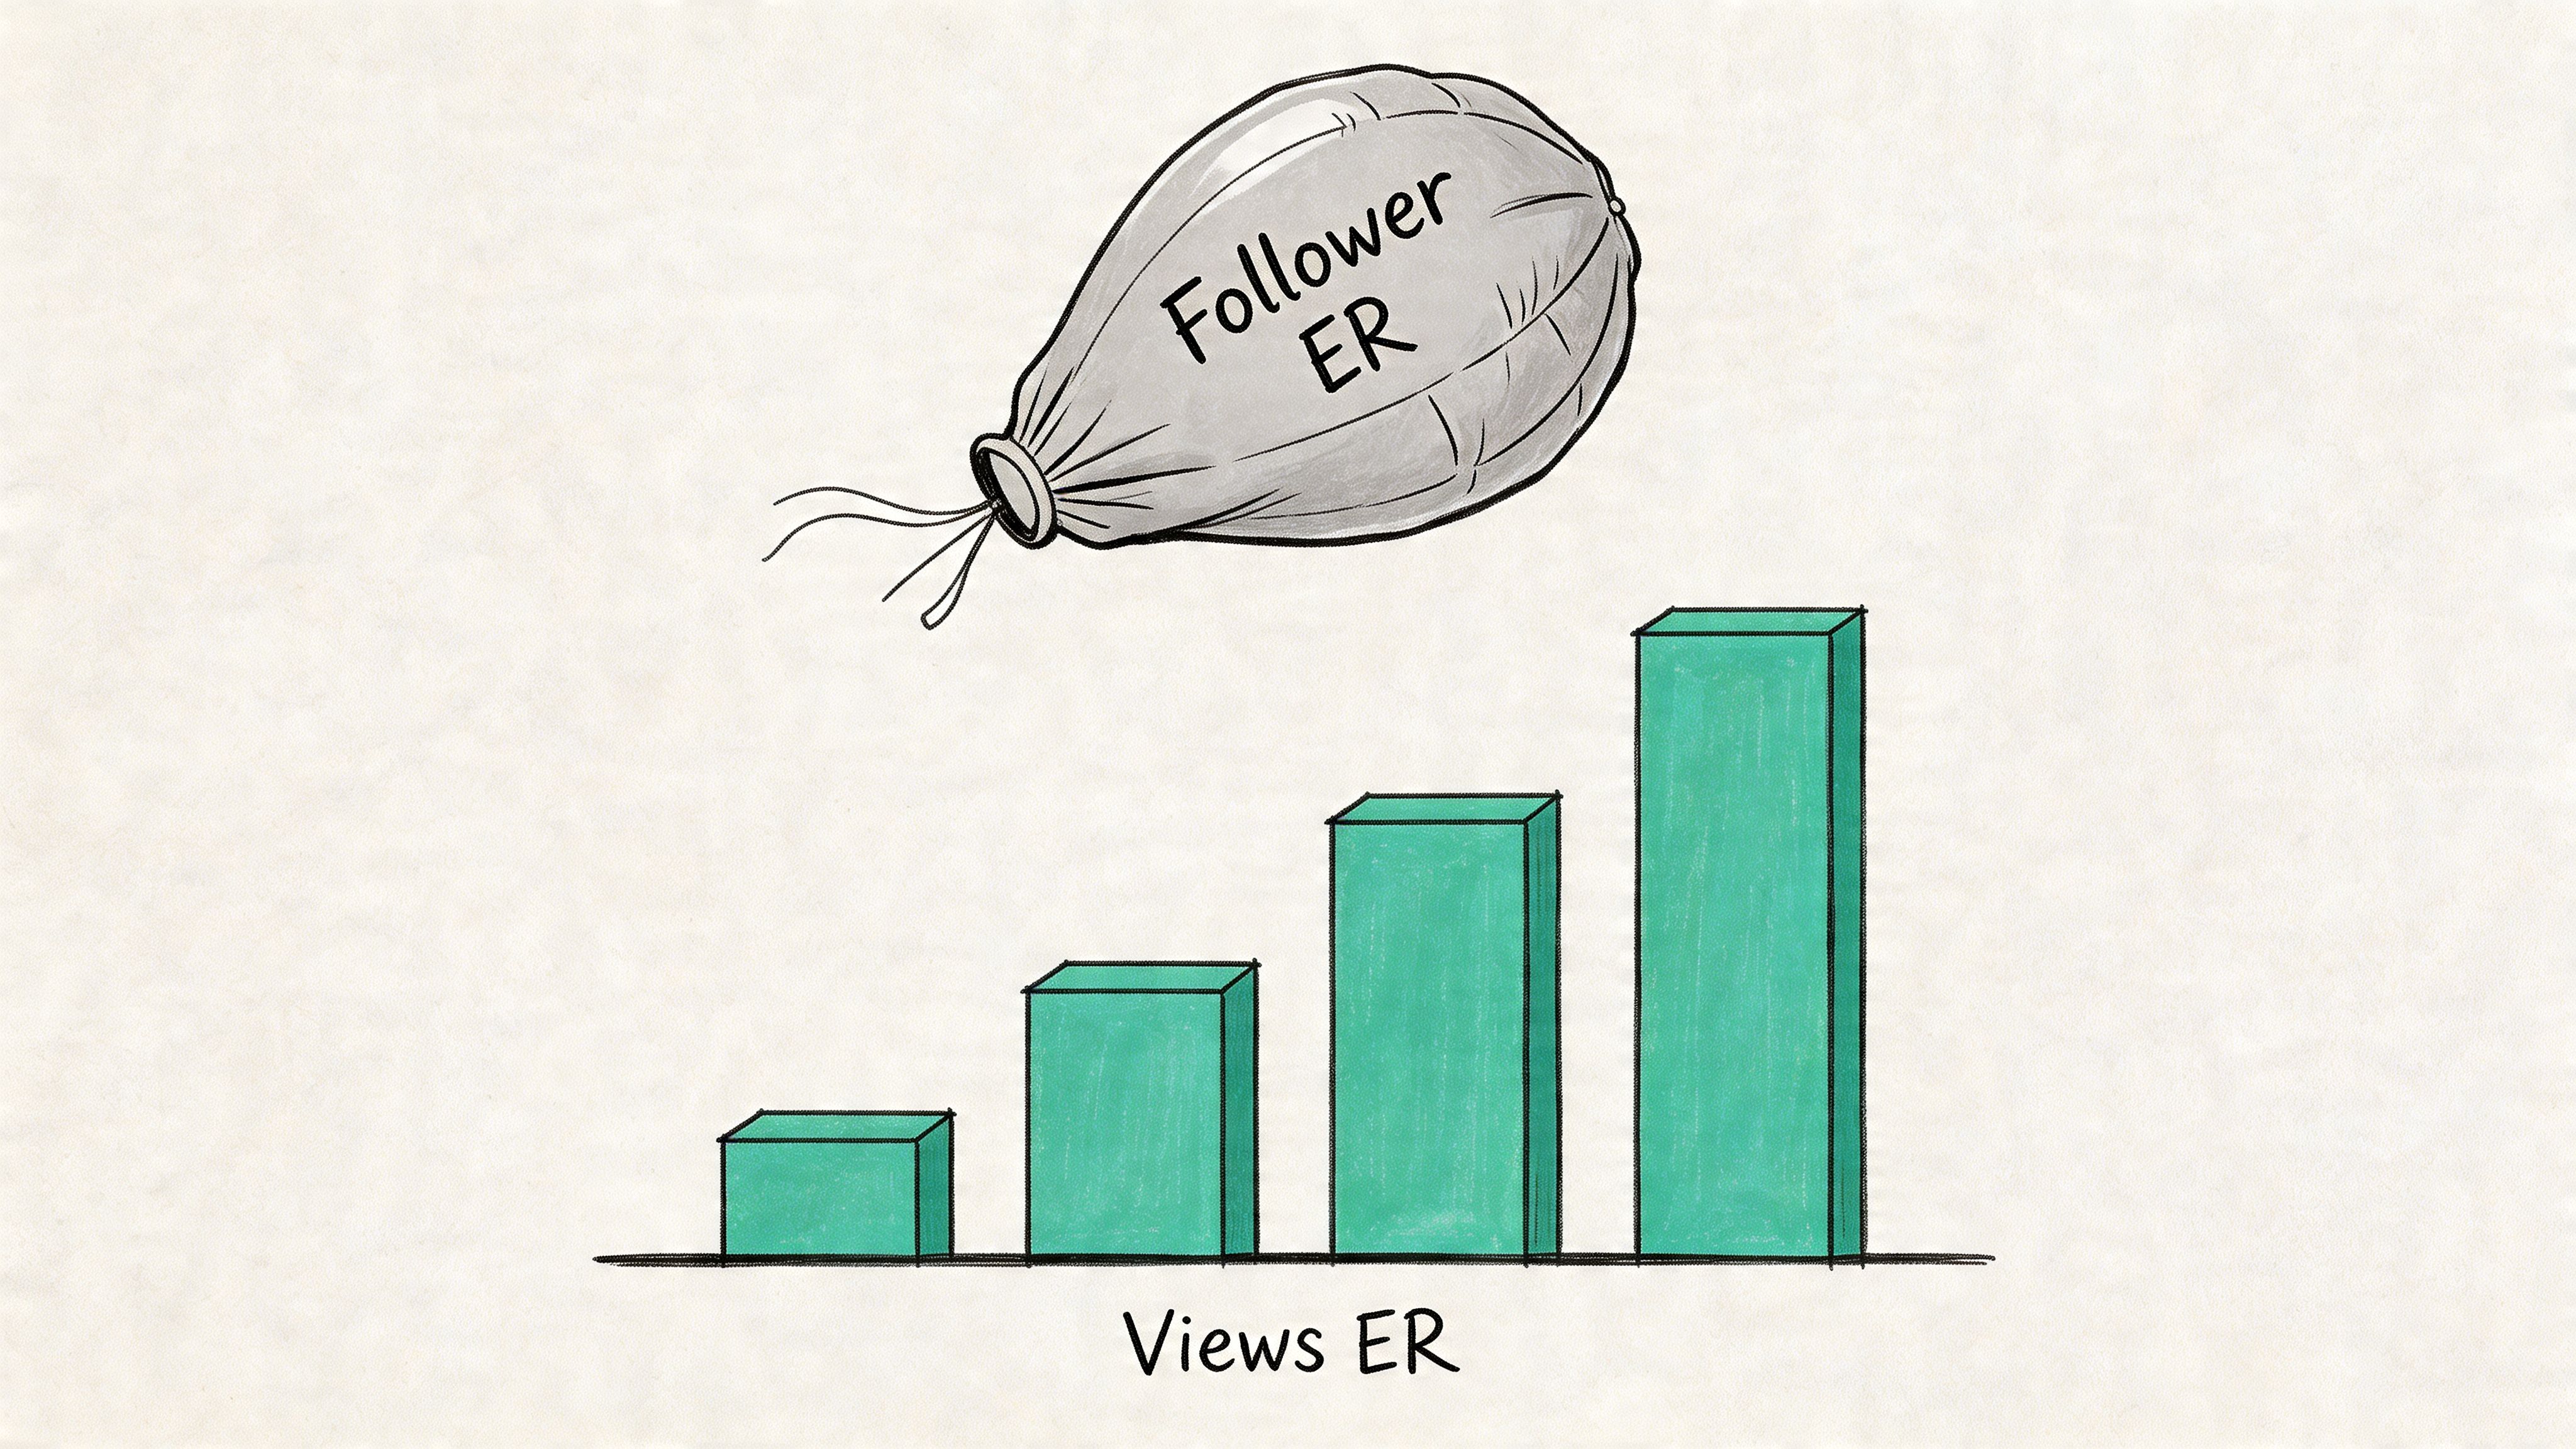
Why Views Matter More Than Followers on TikTok
TikTok changed the logic of engagement measurement. The old formula treated followers as the base audience. That made some sense on platforms where distribution leaned heavily on existing subscribers. TikTok doesn’t work like that.
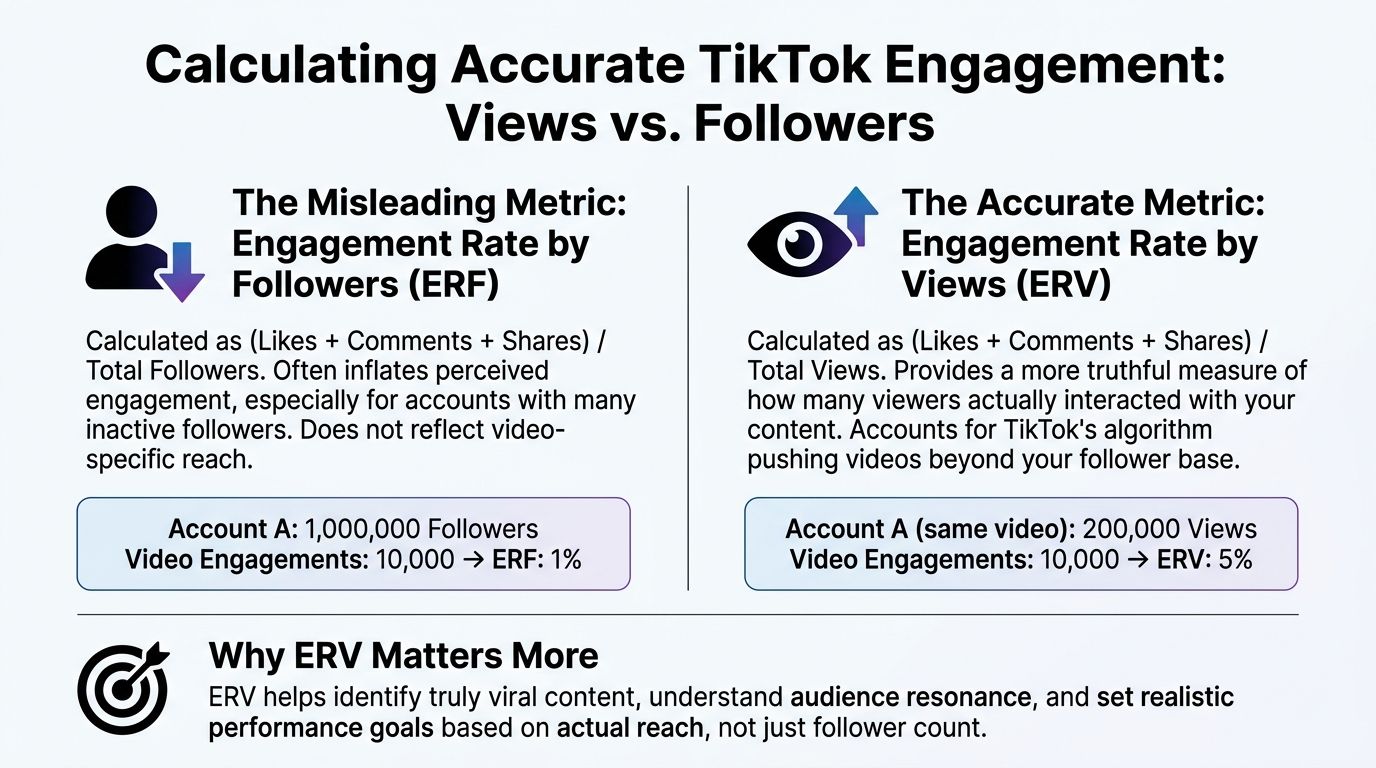
According to WASK’s explanation of TikTok engagement methodology, the industry has shifted from a traditional follower-based approach to a views-based metric, where total interactions are divided by total video views. The same source notes that this has become the modern standard because it offers a fairer comparison across influencers and niches, and better reflects how recommendation systems work.
What a views-based metric actually measures
A views-based engagement rate answers a more useful question than a follower-based one. It asks, “Of the people who watched this video, how many interacted with it?”
That’s a better proxy for content strength. It removes some of the distortion that comes from inflated follower counts, inactive audiences, or creators whose follower base doesn’t match their current performance.
Consider what brands are really trying to compare:
A nano creator with modest followers but strong video resonance
A larger account with a broad audience but uneven distribution
A local creator whose reach comes from For You Page discovery rather than repeat followers
If you benchmark all three on follower count, you blur the distinction between account size and content response.
Core takeaway: On TikTok, the cleaner metric measures the performance of the video, not the size of the account.
Why this matters for creator selection
Teams often waste money by using a legacy formula that makes a creator look safer than they really are. Then they wonder why one creator with a smaller audience outperformed the “bigger” pick on views, clicks, or code use.
Views-based engagement gives you a more realistic first filter because it aligns with how TikTok content spreads. A strong creator isn’t just someone who collected followers in the past. It’s someone whose videos still trigger action once they land in front of viewers.
The commercial trade-off
Follower-based metrics still have a place as background context. They can help you understand audience scale and creator maturity. But they’re weak as the main decision metric on TikTok.
Views-based engagement is more useful when you need to answer practical buying questions:
Is this creator consistently producing content that gets a reaction?
Are we seeing genuine audience response at the video level?
Can we compare creators from different niches without over-rewarding size?
That’s why a modern tiktok engagement rate calculator should prioritise views first. If the tool leads with followers, it’s solving yesterday’s problem.
How to Accurately Calculate TikTok Engagement
Manual calculation is useful for one reason only. It teaches you what the metric includes before software starts scoring creators for you.
For TikTok, the cleanest manual formula is Engagement Rate by Views, or ERV. It measures how people responded after the video reached them, which makes it the right starting point for campaign analysis.
The formula to use
For UK TikTok campaigns, The Influencer Marketing Factory outlines the ERV method as:
ERV = [(Likes + Comments + Shares + Saves) / Views] × 100
The detail that gets missed is saves. Brands that leave saves out usually understate performance on content that people want to revisit, reference, or act on later.
Where to pull the numbers
If you are doing this by hand, collect the data from recent videos or from platform analytics when you have campaign access. Use the same post window for every creator, otherwise your comparisons fall apart.
You need five inputs:
Likes
Comments
Shares
Saves
Views
A single-post calculation is fine for a spot check. For creator vetting, use a sample of recent posts so one viral clip does not distort the account’s normal performance.
A worked example
A restaurant collaboration might look like this:
1,300 likes
2,000 comments
180 shares
1,900 saves
139,000 views
First, total the engagements:
1,300 + 2,000 + 180 + 1,900 = 5,380
Then divide by views:
5,380 / 139,000 = 0.0386
Then multiply by 100:
ERV = 3.86%
That is the output a reliable tiktok engagement rate calculator should produce.
Practical rule: If your calculator excludes saves, it is understating audience response.
Build it in a spreadsheet if you must
A spreadsheet works for a small shortlist. Set up columns for creator name, video URL, likes, comments, shares, saves, views, and ERV, then calculate the average across the sample.
That process has value. It forces teams to define the denominator, the post window, and the engagement inputs before anyone starts comparing creators. If you want a cross-platform reference point, this guide to Instagram engagement rate formulas and benchmarks shows how the calculation changes by network and format.
Formula accuracy is only part of the job. Audience quality still matters, which is why material on understanding audience connection on social is useful alongside any calculator.
Where manual calculation starts to fail
The problem is not the maths. The problem is what happens after the maths.
Once you are reviewing dozens of creators, manual ERV becomes slow, inconsistent, and easy to manipulate. One teammate pulls the last 10 posts. Another uses 30 days. Someone else selectively excludes weaker videos. You end up with neat percentages and weak decisions.
That is the ultimate ceiling of manual calculation. It tells you how a post performed, but not whether that creator drives clicks, code uses, leads, or bookings.
A platform like Sup closes that gap. It does the calculation, standardises the sample, and ties engagement back to commercial outcomes so teams can stop reporting activity and start judging creator ROI. That is the shift that matters. The manual "how" is easy. The automated "so what" is where better media buying starts.
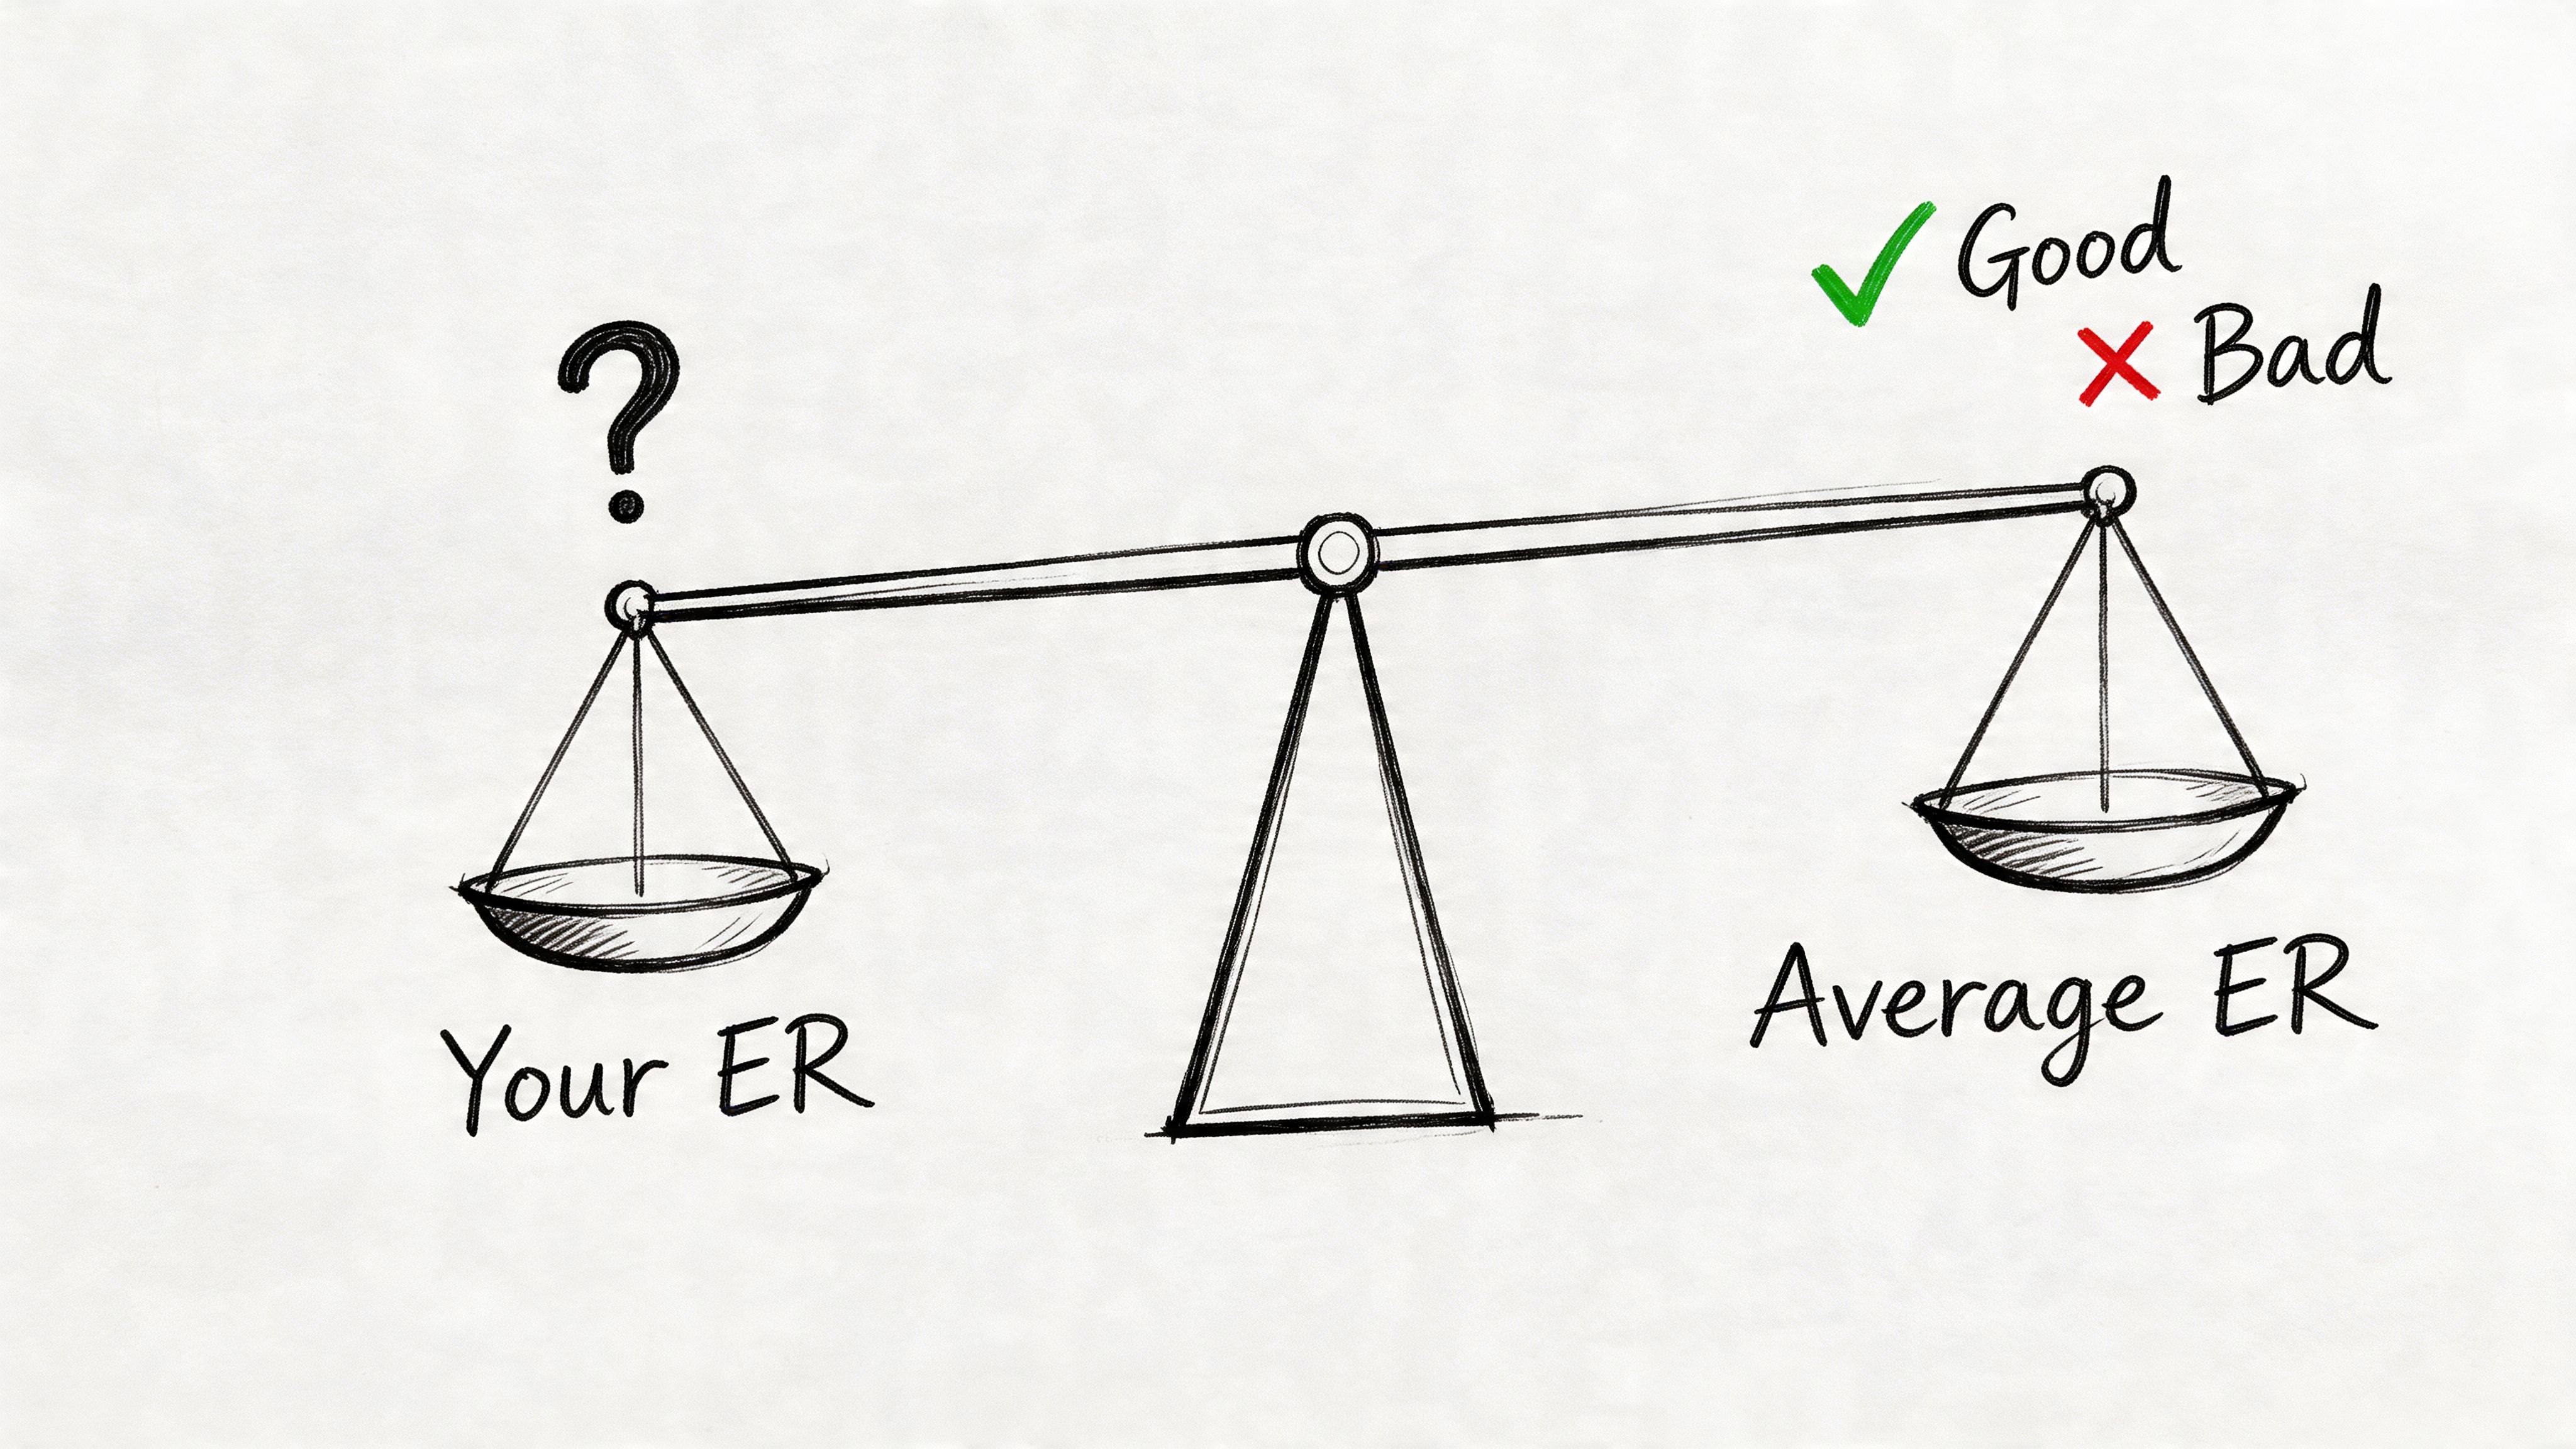
What is a Good TikTok Engagement Rate
A number on its own tells you very little. 3% can be strong in one context and underwhelming in another if you don’t know the baseline, the creator tier, or the campaign objective. Benchmarks give the metric meaning.
According to Hootsuite’s TikTok engagement rate calculator guide, the overall average TikTok engagement rate sits around 2.1% to 3.30%. The same source categorises performance this way:
Under 1% is low
1% to 2% is average
2% to 4% is high
4% or above is excellent
How to read the benchmark properly
These thresholds are useful, but they aren’t a licence to judge every creator the same way. A local hospitality creator, a broad lifestyle account, and a product-led ecommerce creator won’t all perform under identical conditions.
What the benchmark does give you is a quick sorting mechanism:
Performance tier | What it suggests |
|---|---|
Under 1% | Weak audience response or poor content fit |
1% to 2% | Serviceable, but not standout |
2% to 4% | Strong engagement relative to common performance bands |
4% and above | Excellent content response |
Where brands misread “good”
Teams often treat a good engagement rate as proof that a creator is right for the campaign. It isn’t. It’s proof that their content can generate interaction.
That still leaves several unanswered questions:
Does the creator match your location or niche?
Do viewers respond in a way that suggests intent, not just passive entertainment?
Can you track what happened after the post?
A creator with a high ERV can still be a poor commercial fit if the audience doesn’t align. The benchmark is a filter, not a verdict.
A good engagement rate gets a creator onto the shortlist. Attribution decides whether they stay on it.
If you’re setting internal KPIs for creator programmes, broader influencer marketing benchmark context can help teams avoid setting goals in a vacuum. The useful move isn’t chasing one universal percentage. It’s setting a threshold, testing against tracked outcomes, then refining from there.
Common Calculation Mistakes and Alternative Formulas
The maths of engagement isn’t hard. The discipline is. Most bad analysis comes from inconsistent inputs, weak sampling, or using a formula that answers the wrong question.
The mistakes that distort your numbers
A tiktok engagement rate calculator becomes misleading when the setup is sloppy. These are the errors that show up most often in campaign reviews:
Ignoring saves because they’re less visible than likes or comments.
Cherry-picking viral posts instead of using a recent, balanced sample.
Mixing timeframes across creators, which makes one account look stronger because you chose a hotter period.
Comparing follower-based and views-based results as if they mean the same thing.
Treating one engagement figure as final proof of ROI when it’s only an input.
Those errors don’t just create messy reports. They lead to poor creator selection and weak budget allocation.
The legacy formula some teams still use
Views-based ERV is the better default for TikTok, but some teams still rely on Engagement Rate per Post by Followers, or ERPF.
According to Socialinsider’s TikTok engagement calculator data, average ERPF is 1.31% for TikTok influencers, and top-quartile nano creators in hospitality reach 4.2% to 6.5%. The same source notes that this legacy formula can mislead because UK audits found 12% to 15% fake follower prevalence in some niches, which distorts the denominator.
That’s the core weakness of follower-based analysis. It assumes the follower base is a trustworthy anchor. On TikTok, that assumption is often too generous.
TikTok engagement formula comparison
Formula | Calculation | Best For | Key Weakness |
|---|---|---|---|
ERV | (Likes + Comments + Shares + Saves) / Views × 100 | Comparing video-level performance on TikTok | Doesn’t tell you whether engagement converted |
ERPF | Average engagements per post / Followers × 100 | Historical account-level comparisons | Follower count can distort the signal |
Simple follower ER | Total engagements / Followers × 100 | Quick top-line checks | Weak fit for For You Page distribution |
Post-by-post manual ERV | Engagements on one video / Views × 100 | Auditing a specific piece of content | Too narrow if used without a wider sample |
When an alternative formula is still useful
Follower-based formulas aren’t worthless. They’re just limited.
They can still help when you want to understand how an account performs relative to its own audience base over time, or when you’re reviewing creator history in a legacy reporting setup. But if the decision is about who to hire for a TikTok campaign, ERV is usually the stronger front-end metric.
Use follower-based formulas for background context. Use views-based formulas for buying decisions.
What works better in practice
The strongest workflow is simple:
Start with ERV to assess content response.
Review several recent posts, not just one.
Check qualitative fit, including niche, location, and creative style.
Tie campaign delivery to trackable actions such as code use, clicks, bookings, or purchases.
That last step is what most manual calculators never touch. They stop at engagement when the actual question starts after it.
From Calculation to Conversion Using Sup
A manual tiktok engagement rate calculator is useful for education, spot checks, and internal sanity checks. It isn’t enough to run a serious creator programme at scale.
The problem isn’t the formula. The problem is everything around it. Teams still have to source creators, verify fit, manage outreach, organise deliverables, issue codes, build UTM links, collect content, chase posting dates, and report on outcomes. Once campaigns spread across multiple stores, launches, or regions, spreadsheets stop being control systems and start becoming cleanup tools.
What the manual workflow misses
Most brands don’t fail because they can’t calculate ERV. They fail because they can’t operationalise it.
They know how to identify a creator with decent engagement. They don’t have a reliable process for answering the harder questions:
Which creators fit each location, audience, or product line?
Which collaborations produced clicks, redemptions, bookings, or sales?
Which creators deserve repeat spend?
Which content assets should be reused in paid social or organic channels?
That’s the significant shift from calculation to ROI. You need a system that doesn’t just score creators, but also tracks what happened after the content went live.
Why attribution changes the standard
A good campaign workflow connects engagement metrics to business events. That means unique promo codes, UTM links, content tracking, and one place to review performance across creators.
If you’re also using paid amplification, it helps to understand how TikTok Promote works so you can separate native creator performance from boosted distribution. That distinction matters because paid support can lift visibility, but it doesn’t fix weak creator fit or poor creative.
What an ROI-first setup looks like
An effective influencer operating model should do four things well:
Source accurately by matching creators to niche and location, not just account size.
Standardise measurement so every creator is judged on consistent engagement inputs.
Track outcomes directly through unique links, promo codes, bookings, or purchases.
Preserve the content value by storing UGC for reuse after the campaign ends.
A done-with-you platform changes the economics of the channel. Instead of calculating engagement in one tool, tracking codes in another, and reporting conversions in a third, the workflow stays connected.
The result is better than convenience. It’s better decision quality. You stop asking, “Which creator had the nicest-looking engagement rate?” and start asking, “Which creator reliably produced measurable business outcomes?”
That’s the practical use of engagement data. Not as a vanity score. As an input into repeatable campaign allocation.
A tiktok engagement rate calculator still has a place. It teaches the right denominator, catches weak vetting, and improves creator selection. But the brands that get a real edge don’t stop at the calculator. They build a measurement system that ties content performance to revenue signals, then use that system to scale what works and cut what doesn’t.
If you want that without juggling spreadsheets, creator DMs, tracking links, and post-campaign guesswork, Sup gives brands a done-with-you way to launch, manage, and attribute creator campaigns across TikTok and Instagram. It’s built for teams that want more than engagement percentages. They want clear visibility into views, clicks, code redemptions, bookings, sales, and which creators are worth backing again.

Matt Greenwell
Share